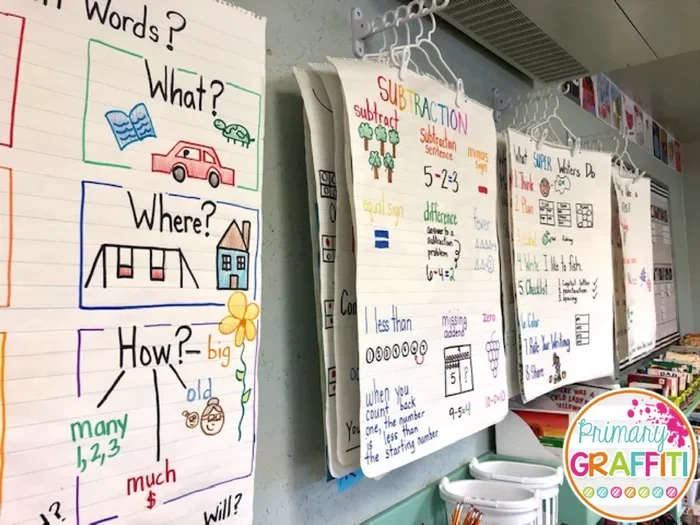
An anchor chart in education is a visual learning tool created during lessons to capture key ideas, strategies, and expectations. Teachers and students build these charts together, making learning visible and memorable. They support visual learning, student engagement, and independent work across all subjects.
If you have walked into a classroom lately, you have probably noticed colorful charts hanging on the walls. These are not just decorations. They serve a real purpose. An anchor chart in education is a powerful teaching tool that helps students learn, remember, and apply new concepts. Teachers create these charts during lessons, and they stay up on the wall as a reference point. Think of them as a visual snapshot of the learning journey. They capture the most important ideas in a way that is easy to understand. In this article, we will explore what anchor charts are, why they matter, and how you can use them effectively.
Whether you are a teacher looking for fresh ideas or a parent curious about classroom tools, this guide has you covered. We will break down the basics, share practical tips, and answer common questions. By the end, you will see why anchor charts are a staple in modern classrooms. They are simple, effective, and backed by solid teaching principles. Let us dive in.
Key Takeaways
- Anchor charts make thinking visible: They record strategies, processes, and guidelines that students can reference anytime.
- They boost student engagement: When learners help create charts, they take ownership of their education.
- Anchor charts work across all subjects: From reading and writing to math and science, they fit any lesson.
- They support different learning styles: Visual, auditory, and kinesthetic learners all benefit from these tools.
- They are simple to create: You do not need fancy supplies or advanced design skills to make effective charts.
- They promote independence: Students use charts as reference tools, reducing the need for constant teacher reminders.
📑 Table of Contents
What Is an Anchor Chart in Education?
An anchor chart is a visual aid created during a lesson. It typically includes key points, examples, strategies, and step-by-step processes. Teachers and students work together to build the chart. The word “anchor” is important here. The chart anchors learning in students’ minds. It gives them something concrete to refer back to when they need help.
These charts are not pre-made posters you buy online. They are created in real time during instruction. This is what makes them so powerful. Students see the thinking process unfold right before their eyes. They become active participants in their own learning. An anchor chart in education is like a roadmap. It shows students where they have been, where they are, and where they are going.
What Makes an Anchor Chart Different From a Regular Poster?
You might wonder how an anchor chart differs from a regular classroom poster. The key difference is timing and ownership. A regular poster is often pre-designed and printed. An anchor chart is built with students during the learning process. This shared creation builds connection and relevance. Students remember what they helped build. They also understand the purpose behind each element on the chart.
Another difference is flexibility. Anchor charts can change as learning progresses. Teachers add new ideas, cross out outdated information, or expand on existing content. This mirrors the natural flow of a lesson. It keeps the chart fresh and useful. A static poster cannot do that.
Common Types of Anchor Charts
Not all anchor charts look the same. They come in different shapes and sizes depending on the subject and the lesson. Here are some common types you will see in classrooms:
- Process charts: These break down a step-by-step procedure. For example, a chart showing how to solve a math problem or how to write a paragraph.
- Strategy charts: These teach specific learning strategies. Think about how to summarize a text or how to check your work in math.
- Reference charts: These list facts, rules, or vocabulary that students need to remember. A grammar rules chart or a multiplication table chart would fall into this category.
- Behavioral charts: These set expectations for classroom conduct. They help students understand what respectful and responsible behavior looks like.
- Comparison charts: These help students compare and contrast ideas. For instance, comparing fiction and nonfiction texts or comparing two historical events.
Each type serves a unique purpose. The best teachers use a mix of chart types to cover different learning needs. When a chart is built with a clear purpose, it becomes a classroom visual aid that students genuinely use.
Why Anchor Charts Matter in the Classroom
Now that you know what an anchor chart in education is, let us talk about why they matter so much. The reasons go beyond just decorating a wall.
They Support Visual Learning
Not every student learns the same way. Some students are visual learners. They grasp ideas better when they see them organized on a page. An anchor chart gives visual learners the structure they need. It breaks complex ideas into smaller, digestible pieces. Colors, icons, and labels all help reinforce the message. This makes the learning tool accessible to more students.
They Promote Student Engagement
When students help build a chart, they feel a sense of ownership. They are not just passive listeners. They are active contributors. This involvement increases their student engagement and motivation. They want to look at the chart because they helped create it. They want to refer to it because it feels like “their” work. This sense of ownership is a powerful driver of interactive learning.
They Build Independence
One of the biggest goals in education is to raise independent learners. An anchor chart helps students do exactly that. Instead of raising their hand every time they forget a step, they can look at the wall. The chart becomes a self-service tool. It reduces the need for constant teacher reminders. Over time, students internalize the strategies on the chart. They start using them without thinking. That is the real goal of any instructional chart.
They Support Differentiated Instruction
Every classroom has students at different skill levels. An anchor chart can meet them where they are. Advanced learners might use the chart as a springboard for deeper thinking. Struggling learners can use it as a safety net. The chart provides a consistent reference point for everyone. This is a key element of differentiated instruction. It ensures that no student is left behind.
They Create a Positive Classroom Culture
When charts are created collaboratively, they build community. Students work together, share ideas, and respect each other’s contributions. This collaborative learning environment makes the classroom feel safe and welcoming. It also reinforces the idea that learning is a shared journey. A well-designed classroom wall chart reflects the values and energy of the class.
How to Create an Effective Anchor Chart
Creating an anchor chart in education does not require artistic talent or expensive supplies. It requires a clear plan and a willingness to involve your students. Here is a simple step-by-step process you can follow.
Step 1: Identify the Learning Goal
Before you pick up a marker, know exactly what you want the chart to teach. Are you teaching a reading strategy? A math process? A writing skill? Write down the main objective. This keeps the chart focused and purposeful. A chart without a clear goal becomes just another decoration on the wall.
Step 2: Gather Your Materials
You do not need anything fancy. A large piece of chart paper and a few markers are all you need. Some teachers prefer bulletin board paper because it is big and sturdy. Others use sticky notes for flexibility. Whatever you choose, make sure it is visible from all seats in the room. The chart should be easy to read from a distance.
Step 3: Build the Chart During the Lesson
This is the most important step. Do not pre-write the chart. Instead, build it with your students. Start with the title or learning goal. Then add key points as you teach. Ask students for their ideas and examples. Write them down in real time. This live creation is what makes the chart an educational poster with real value.
Step 4: Use Simple Language and Visuals
Keep the wording short and clear. Use bullet points, arrows, and boxes to organize information. Add simple drawings or symbols to support the text. For younger students, use bright colors and large fonts. For older students, you can include more detailed notes. The goal is clarity, not perfection.
Step 5: Leave Space for Growth
Do not fill the entire chart in one lesson. Leave blank space for additions. As you revisit the topic, students can add new ideas or examples. This keeps the chart dynamic and relevant. A chart that grows with the class is far more valuable than one that is complete on day one.
Quick Tips for Better Anchor Charts
- Use no more than three to five colors to keep the chart visually organized.
- Write in large, legible handwriting so every student can read it.
- Include student-generated examples whenever possible.
- Hang the chart at eye level for your students.
- Take a photo of the chart so you can recreate it for future classes.
- Revisit the chart regularly and update it as needed.
Anchor Charts Across Different Subjects
One of the best things about an anchor chart in education is its versatility. You can use it in virtually any subject area. Let us look at how anchor charts work in some common subjects.
Reading and Language Arts
In reading class, anchor charts are incredibly useful. Teachers use them to teach reading comprehension strategies. For example, a chart might show the steps for finding the main idea in a text. Another chart could illustrate how to make inferences while reading. Some teachers also use charts to teach figurative language like similes and metaphors. If you want to explore how similes are used in education, check out our similes for education guide. Similarly, our metaphors for education and idioms for education pages offer great examples that can be turned into anchor chart content.
Writing anchor charts are also popular. They might show the structure of a persuasive essay or the steps for writing a friendly letter. These charts give students a clear framework to follow. They reduce the anxiety that comes with a blank page.
Math
Math classes benefit from anchor charts too. A chart might outline the steps for long division or explain how to find the area of a rectangle. Some charts list key formulas or math vocabulary. These math anchor charts serve as constant reminders of strategies students have learned. They are especially helpful during independent practice or test review.
Science and Social Studies
In science, anchor charts can summarize the steps of the scientific method or label parts of a plant cell. In social studies, they might map out the branches of government or list key events in a historical period. The visual format helps students organize complex information. It turns abstract concepts into something concrete and memorable.
Social-Emotional Learning
Anchor charts are not limited to academic subjects. They also play a role in social-emotional learning. Charts about empathy, conflict resolution, or emotional regulation can be powerful tools. They give students a visual reminder of how to navigate social situations. This is a growing area of interest in classroom management and student well-being.
Common Mistakes to Avoid When Using Anchor Charts
Anchor charts are simple to make, but there are some common pitfalls. Here are mistakes to watch out for:
- Making charts too complex: If a chart is overloaded with information, students will not use it. Keep it focused and concise.
- Creating charts before the lesson: Pre-made charts remove the collaborative element. Students lose ownership when the chart is already finished.
- Ignoring the chart after creation: A chart that hangs on the wall but is never referenced becomes wallpaper. Revisit it often and refer to it during lessons.
- Using poor handwriting or formatting: If students cannot read the chart, it will not help. Take time to write clearly and organize the layout.
- Leaving charts up forever: Charts should reflect current learning. Remove outdated charts to keep the classroom environment focused and relevant.
Avoiding these mistakes will help you get the most out of every anchor chart in education. Remember, the goal is to support learning, not to create clutter.
Expert Insights on Anchor Charts
Many experienced educators swear by anchor charts as a core teaching strategy. Research in visual learning supports their effectiveness. When students see information organized visually, they are more likely to retain it. Studies show that combining words with images improves memory and understanding.
Experts also highlight the role of anchor charts in building a growth mindset. When a chart shows that learning is a process, it normalizes struggle and progress. Students see that even the chart started as a blank page and grew through effort. This mirrors their own learning journey. It sends a powerful message: learning is something we build together, one step at a time.
What the Research Says
Studies on graphic organizers and visual teaching tools show consistent benefits. Students who use visual references score higher on retention tests. They also show increased confidence during independent work. The reference chart format of an anchor chart aligns with these findings. It gives students a reliable tool they can trust. Teachers who use anchor charts regularly report higher levels of collaborative learning in their classrooms. Students talk more, refer to the charts more, and take more ownership of their progress.
How to Make Anchor Charts Work for You
If you are new to anchor charts, start small. Pick one subject and one lesson. Create a simple chart with your students. Reflect on how it went. What worked? What could you improve? Over time, you will develop your own style and approach. There is no single “right” way to make an anchor chart. The best charts are the ones that actually help your students learn.
Consistency is key. Make anchor charts a regular part of your teaching routine. Use them in every lesson where a visual reference would help. Over time, your students will come to expect and rely on them. They will become a natural part of the learning environment. And that is exactly what an anchor chart in education is meant to do. It anchors learning in a way that is visible, accessible, and lasting.
Conclusion
An anchor chart in education is more than just a piece of paper on a wall. It is a dynamic teaching tool that supports visual learning, student engagement, and independent work. Whether you are teaching reading, math, science, or social-emotional skills, anchor charts can make a real difference. They are easy to create, flexible in use, and backed by solid teaching research. Start small, stay consistent, and watch your students grow more confident and independent. The power of a well-made anchor chart should never be underestimated. It is one of the simplest and most effective tools in any teacher’s toolkit.
Frequently Asked Questions
What is the purpose of an anchor chart in education?
The purpose of an anchor chart in education is to capture key learning points, strategies, and expectations during a lesson. It serves as a visual reference that students can return to for support. It makes thinking visible and helps students become more independent learners.
Who creates an anchor chart?
Anchor charts are created collaboratively by the teacher and students during a lesson. The teacher guides the process, but students contribute ideas, examples, and content. This shared creation builds ownership and makes the chart more meaningful.
When should you use an anchor chart?
You should use an anchor chart whenever a lesson benefits from a visual reference. They work well in reading, writing, math, science, and social studies. They are also useful for teaching classroom routines and behavioral expectations.
How do anchor charts support different learning styles?
Anchor charts support visual learners through images and colors. They support auditory learners through the discussion that happens during creation. They support kinesthetic learners through the hands-on act of building the chart. This makes them a versatile tool for all learners.
Can anchor charts be used for remote or hybrid learning?
Yes, anchor charts can be adapted for remote learning. Teachers can create digital anchor charts using tools like Google Slides or Jamboard. They can share screens during live lessons or post charts in virtual classrooms. The core purpose remains the same: to provide a visual reference for students.
How often should you update or remove anchor charts?
Anchor charts should be updated as learning progresses. Add new information when students are ready. Remove charts that no longer align with current lessons. A good rule of thumb is to keep charts that students are actively using and remove ones that have served their purpose.