A graphic organizer in education is a visual tool that helps students map out ideas, organize information, and understand relationships between concepts. It is one of the most effective teaching strategies used in classrooms today. Teachers use graphic organizers to improve reading comprehension, writing skills, and critical thinking in learners of all ages.
A graphic organizer in education is a visual diagram or chart that helps learners structure and understand information. Think of it as a map for your brain. Instead of reading a wall of text, you get to see how ideas connect, flow, and relate to each other.
Teachers have been using these tools for decades, and for good reason. They work. Whether you are a elementary school teacher or a college professor, a well-designed graphic organizer can transform a confusing lesson into something clear and memorable. The best part? They are simple to create and incredibly versatile.
In this article, we will explore exactly what a graphic organizer is, why it matters, and how you can start using one in your classroom or study routine today. We will also look at different types, real-world examples, and practical tips that make a real difference.
Key Takeaways
- Visual Learning Made Simple: A graphic organizer in education turns complex ideas into easy-to-understand visual maps and charts.
- Boosts Student Engagement: Students stay more focused and involved when they interact with information visually rather than through text alone.
- Improves Retention and Recall: Organizing knowledge visually helps the brain store and retrieve information more effectively.
- Supports All Subjects: From science to language arts, graphic organizers fit into every classroom and lesson plan.
- Easy to Create and Use: You do not need special software or training to start using graphic organizers today.
- Builds Critical Thinking: Students learn to analyze, compare, and connect ideas instead of just memorizing facts.
📑 Table of Contents
What Exactly Is a Graphic Organizer?
A graphic organizer is a visual framework that organizes information in a structured way. It uses shapes, lines, arrows, and labels to show relationships between ideas. Instead of reading paragraphs of text, students can look at a diagram and instantly see the big picture.
These tools come in many forms. Some look like webs. Others look like charts or timelines. The common thread is that they all use visuals to make learning easier. They turn abstract concepts into something concrete and tangible.
Why Visual Tools Work So Well
Our brains are wired for visuals. Research in educational psychology shows that the human brain processes images much faster than text. When you see a diagram, your brain creates mental connections almost instantly. This is why a graphic organizer in education is so powerful.
Visual tools also reduce cognitive load. That is a fancy way of saying they make your brain work less hard. Instead of trying to hold multiple ideas in your head at once, you can look at a chart and see everything laid out clearly. This frees up mental energy for deeper thinking and problem-solving.
For students who struggle with traditional reading and writing tasks, graphic organizers are a game-changer. They provide a different entry point into the same material. Every learner can find a way in.
Types of Graphic Organizers You Should Know
Not all graphic organizers look the same. Different types serve different purposes. Let us walk through the most common ones you will encounter in classrooms.
Venn Diagrams
A Venn diagram uses overlapping circles to compare and contrast ideas. Each circle represents a topic, and the overlapping area shows what they have in common. This is one of the most popular tools for teaching comparison and contrast skills.
Teachers love Venn diagrams because they are simple and intuitive. Students can use them in science, history, language arts, and more. They work great for both individual work and group activities.
KWL Charts
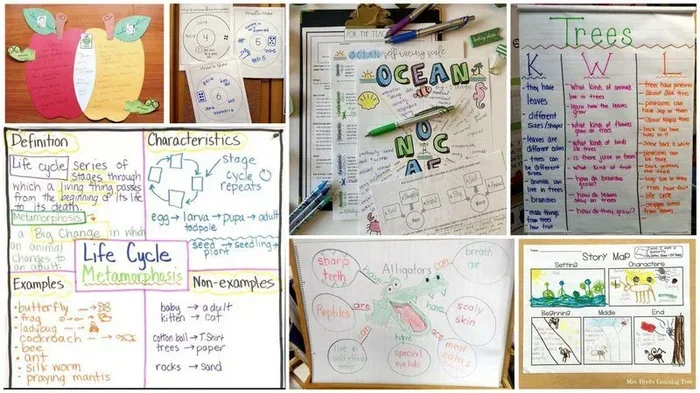
A KWL chart stands for Know, Want to Know, and Learned. It is a three-column organizer that helps students track their understanding before, during, and after a lesson. This tool is especially useful for building reading comprehension and active learning habits.
Before a lesson, students write down what they already know. During the lesson, they note what they want to find out. Afterward, they reflect on what they learned. This simple structure encourages curiosity and self-directed learning.
Story Maps
A story map helps students break down a narrative into its key parts. It typically includes sections for the setting, characters, problem, events, and solution. This type of organizer is a staple in elementary and middle school classrooms.
Story maps do more than just help students retell a story. They teach learners to think about structure and meaning. When students can identify the parts of a story, they become stronger readers and writers.
Mind Maps
A mind map starts with a central idea in the middle and branches outward with related subtopics. This format is perfect for brainstorming techniques and knowledge mapping. Students can see how one big idea connects to many smaller ones.
Mind maps are incredibly flexible. You can use them for planning essays, studying for tests, or organizing project ideas. They work well for visual thinkers and creative learners.
T-Charts and Tables
T-charts divide information into two columns. They are great for sorting facts, comparing options, or categorizing data. Tables take this a step further by adding rows and columns for more detailed organization.
These simple organizers are excellent for information organization. They help students see patterns and group related ideas together. Even reluctant learners find T-charts easy to use.
Why Graphic Organizers Matter in the Classroom
Now that we know what graphic organizers are and what types exist, let us talk about why they matter so much in education. The benefits go far beyond just making things look pretty on a page.
They Improve Learning Retention
When students organize information visually, they remember it better. Studies show that visual learning strategies lead to stronger long-term retention. A graphic organizer in education helps students encode information in a way that is easier to recall later.
This is especially important for exams and standardized tests. Students who use organizers regularly tend to perform better because they have a clearer mental picture of the material.
They Support Differentiated Instruction
Every classroom has learners with different needs. Some students grasp concepts quickly. Others need more support. Graphic organizers bridge this gap by providing a visual scaffold for all learners.
For advanced students, organizers can add complexity. For struggling students, they simplify and clarify. This makes graphic organizers one of the most effective tools for differentiated instruction. You can adjust the level of detail and structure to meet each student where they are.
They Boost Student Engagement
Let us be honest. Sitting and listening to a lecture for forty minutes is tough. Students zone out. Their attention drifts. A graphic organizer changes this dynamic. It gives students something to do with their hands and minds.
When students actively fill in a diagram or chart, they are participating in the lesson. This student engagement leads to better focus, fewer behavior problems, and deeper understanding. Students feel like they are part of the learning process, not just passive listeners.
They Build Critical Thinking Skills
One of the biggest benefits of graphic organizers is that they teach students how to think, not just what to think. When a student fills out a compare-and-contrast chart, they must analyze the information. They must decide where each fact belongs. They must draw connections.
This kind of critical thinking is essential for success in school and beyond. Graphic organizers train students to approach problems systematically and logically. These are skills they will use for the rest of their lives.
How to Use Graphic Organizers Across Subjects
The beauty of a graphic organizer is its versatility. You can use it in almost every subject area. Let us look at some practical examples.
In Language Arts and Reading
Graphic organizers are a natural fit for reading and writing classes. Teachers use story maps to help students understand plot structure. They use cause-and-effect charts to explore character motivations. Venn diagrams work well for comparing two texts or two characters.
For writing instruction, organizers help students plan essays and organize their thoughts before they start writing. A simple outline or web diagram can turn a blank page into a structured starting point. This reduces the anxiety that many students feel about writing tasks.
When teaching figurative language, you can also introduce concepts like similes for education and metaphors for education using graphic organizers. These visual tools help students see the difference between a simile and a metaphor at a glance. You can even use an organizer to categorize idioms for education by theme or meaning, making abstract language concepts much more concrete for young learners.
In Science
Science classes are full of processes, systems, and relationships. A graphic organizer can map out the water cycle, show the parts of a cell, or illustrate a food chain. Students can visualize complex systems that would be hard to understand through text alone.
For experiments, organizers help students plan their methods and organize their results. A simple table can turn messy data into clear, readable information. This teaches students how to think like scientists.
In Social Studies and History
History involves timelines, cause-and-effect relationships, and comparisons between events and cultures. Graphic organizers make these connections visible. Timeline organizers help students understand the sequence of historical events. Venn diagrams work well for comparing ancient civilizations or different government systems.
Students can also use organizers to analyze primary sources or compare different historical perspectives. This builds analytical skills and helps students think more deeply about the past.
In Math
Math might seem like a subject that does not need visuals, but graphic organizers can help. Charts and tables can organize problem-solving steps. Flowcharts can show the order of operations. Concept maps can connect related math topics like fractions, decimals, and percentages.
For word problems especially, organizers help students break down the information and identify what is being asked. This reduces confusion and builds confidence.
Common Mistakes Teachers Make with Graphic Organizers
Graphic organizers are simple tools, but they are easy to misuse. Here are some common mistakes to avoid.
Using Too Many Different Types at Once
It is tempting to introduce a new organizer for every lesson. But this can overwhelm students. Stick to a few core types and let students become comfortable with them before adding more variety.
Mastery beats variety. When students know how to use a Venn diagram well, they can apply that skill across many subjects. Frequent practice with a few organizers builds deeper understanding than surface-level exposure to many.
Making the Organizer Too Complex
A graphic organizer should simplify, not complicate. If your diagram has too many sections or too much text, it defeats the purpose. Keep it clean, clear, and focused on the key ideas.
A good rule of thumb is to ask yourself whether a student could fill out the organizer in five minutes or less. If it takes longer, you may need to simplify the design.
Not Letting Students Create Their Own
Pre-made organizers have their place, but students learn more when they build their own. When students design their own diagram, they must think deeply about how ideas connect. This active construction of knowledge leads to stronger learning outcomes.
Try giving students a blank template and letting them decide how to organize the information. You will be surprised by their creativity and insight.
Using Organizers Only for Assessment
Graphic organizers are powerful assessment tools, but they should not only be used for grading. Use them during the learning process to help students think, not just to check what they remember.
When organizers are part of the learning journey, students engage with them more willingly. They see the value and purpose behind the activity instead of viewing it as just another assignment.
Quick Tips for Getting Started
Ready to start using graphic organizers? Here are some practical tips to help you get going.
- Start simple. Pick one type of organizer and introduce it slowly. Let students practice before moving on to more complex formats.
- Model the process. Show students how to fill out an organizer step by step. Think aloud as you go so they can see your reasoning.
- Use organizers for discussion. Have students compare their organizers with a partner. This sparks conversation and deepens understanding.
- Keep them visible. Display completed organizers on the classroom walls or bulletin boards. This reinforces learning and gives students a sense of pride.
- Make it digital. Use free tools like Canva, Google Drawings, or even PowerPoint to create digital organizers. This adds a modern twist that many students enjoy.
- Rotate types regularly. Once students are comfortable, introduce new organizer types to keep things fresh and challenge different thinking skills.
The Bottom Line
A graphic organizer in education is one of the simplest and most effective tools a teacher or student can use. It makes learning visual, structured, and engaging. Whether you are teaching reading, science, history, or math, there is a graphic organizer that fits your needs.
The research is clear. Visual learning strategies improve retention, boost engagement, and build critical thinking skills. Graphic organizers deliver all of these benefits in a format that is easy to create and use. They are not just a classroom fad. They are a proven teaching strategy that stands the test of time.
If you have not yet tried using graphic organizers in your classroom or study routine, now is the perfect time to start. Pick one type, try it with one lesson, and see the difference for yourself. Your students will thank you for it.
Frequently Asked Questions
What is a graphic organizer in education?
A graphic organizer in education is a visual tool that helps students organize, map, and understand information. It uses diagrams, charts, and structured layouts to show how ideas connect and relate to each other.
Why are graphic organizers important for students?
Graphic organizers improve learning retention, boost student engagement, and build critical thinking skills. They make complex information easier to understand by presenting it visually, which reduces cognitive load and helps students process ideas more effectively.
What types of graphic organizers are most commonly used?
The most common types include Venn diagrams, KWL charts, story maps, mind maps, and T-charts. Each type serves a specific purpose, from comparing ideas to planning writing to tracking learning progress.
Can graphic organizers be used in all subjects?
Yes, graphic organizers are incredibly versatile. They work in language arts, science, social studies, math, and many other subjects. Teachers can adapt the type and complexity of the organizer to fit any lesson or topic.
Do graphic organizers really improve learning outcomes?
Yes, research supports the use of graphic organizers as an effective teaching strategy. Studies show that visual learning tools improve information retention, reading comprehension, and student engagement across all grade levels.
How can I create a graphic organizer for my classroom?
You can create graphic organizers using paper and pencil, whiteboards, or digital tools like Canva and Google Drawings. Start with a simple template, model the process for your students, and let them practice filling it out independently.
=== CONCLUSION ===
A graphic organizer in education is a simple yet incredibly powerful tool that transforms how students learn. From Venn diagrams to mind maps, these visual frameworks help students organize information, think critically, and retain knowledge longer. They support every learner, regardless of skill level or learning style.
The beauty of graphic organizers lies in their flexibility. You can use them in any subject, at any grade level, and in any learning environment. Whether you are a classroom teacher looking for new strategies or a student searching for better study habits, graphic organizers deliver real results.
Start small. Pick one organizer type and try it in your next lesson. Watch how your students respond. You will see more engagement, deeper understanding, and stronger learning outcomes. The best part is that once you start, you will wonder how you ever taught without them.