what are anchor charts in education is an essential topic that provides valuable insights.
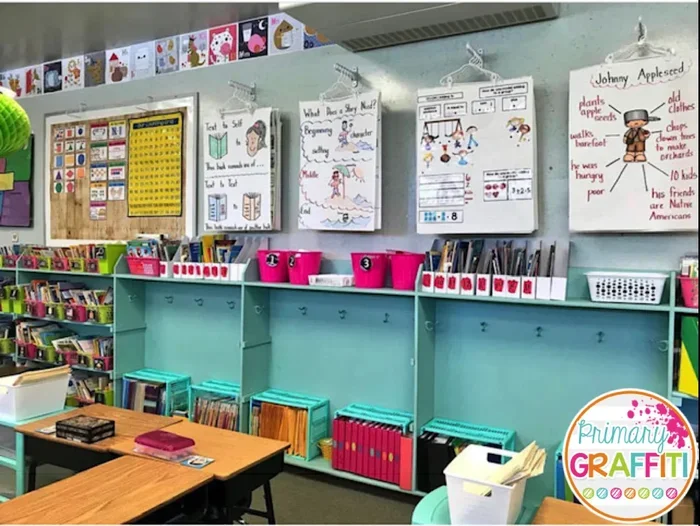
Have you ever walked into a classroom and noticed colorful posters on the walls that seem to teach something all on their own? Those are likely anchor charts. These simple yet powerful visual aids have become a staple in modern classroom learning. They serve as constant reminders of strategies, rules, and concepts that students need to remember.
If you are a teacher looking for fresh teaching strategies, or a parent curious about what your child’s classroom looks like, this guide is for you. We will break down everything you need to know about anchor charts. By the end, you will feel confident creating your own and using them to make a real difference in learning.
Key Takeaways
- Anchor charts are visual teaching tools: They help students grasp and retain new concepts through clear, colorful displays.
- They boost student engagement: When students interact with charts, they become active participants in their own learning.
- Creating them is simple: You do not need artistic skill, just a clear learning goal and a few basic supplies.
- They work across every subject: From math to reading, anchor charts adapt to any topic or grade level.
- Common mistakes are easy to avoid: Keep charts simple, updated, and student-centered for the best results.
- They support all learners: Visual, auditory, and kinesthetic learners all benefit from well-designed charts.
📑 Table of Contents
What Exactly Is an Anchor Chart?
An anchor chart is a visual tool created during or after a lesson. It captures the most important ideas from a class in a clear and organized way. Think of it as a snapshot of the learning that happened in that room. Teachers and students often build these charts together, making them a shared resource.
The word “anchor” is key here. Just like an anchor holds a ship in place, these charts anchor learning in students’ minds. They give kids something concrete to look at when they forget a concept or need a refresher. Unlike store-bought educational posters, anchor charts are made in real time with your specific class in mind.
Most anchor charts are written on large chart paper or displayed digitally. They use a mix of words, drawings, and diagrams. The goal is to make complex ideas easy to understand at a glance. When done right, a chart becomes a go-to teaching resource that students actually enjoy using.
Why the Name “Anchor Chart”?
The term comes from the idea of anchoring new knowledge. When students learn something new, it can feel floating and temporary. An anchor chart grounds that knowledge. It gives it a permanent place in the room. This sense of permanence signals to students that what they learned matters and is worth remembering.
Why Anchor Charts Matter in the Classroom
You might wonder if a simple chart on the wall really makes a difference. The answer is a strong yes. Research and classroom experience both show that visual learning tools improve knowledge retention and deepen understanding. Here is why they matter so much.
Boosting Student Engagement
When students help create an anchor chart, they feel ownership over their learning. They are not just passive listeners anymore. They become active participants. This shift from listening to creating is a game changer for student engagement.
Kids love seeing their own words and drawings on the wall. It makes the learning feel real and personal. A chart that a student helped build is far more meaningful than one the teacher made alone. This sense of pride keeps kids coming back to the chart again and again.
Interactive learning also increases when charts are used during lessons. Instead of just reading from a textbook, students can point to the chart, add to it, or refer back to it during discussions. This keeps the energy in the room high and the focus sharp.
Supporting Different Learning Styles
Not every student learns the same way. Some are visual learners who grasp ideas better through images. Others are verbal learners who thrive on words. Anchor charts blend both. They combine text and visuals in one place, which means they naturally support a wider range of learners.
For students who struggle with traditional lectures, a well-made chart can be the bridge they need. It breaks information into small, digestible pieces. It also gives collaborative learning a boost, since students can point to the chart while working together on tasks.
How to Create Effective Anchor Charts
Making an anchor chart does not require artistic talent or expensive supplies. It requires clear thinking and a bit of planning. Here is how to do it right.
Step-by-Step Creation Process
- Identify the learning goal: Decide exactly what concept or strategy the chart will cover. Keep it focused on one main idea.
- Gather your materials: You need chart paper, markers, and maybe some sticky notes. Digital tools work too if your classroom is tech-forward.
- Build the chart with students: Start the lesson and add elements to the chart as you go. Let students suggest words, drawings, or examples.
- Keep it simple and clear: Use short phrases, not full sentences. Bold key terms. Use colors to group related ideas.
- Display it prominently: Hang the chart where all students can see and reach it. A wall near the teaching area works best.
- Revisit and update: As the unit progresses, add new insights. A living chart stays relevant and useful.
Best Practices for Design
Good design makes a chart more effective. Here are a few tips to keep in mind:
- Use no more than three colors for text to keep it readable.
- Leave plenty of white space so the chart does not feel cluttered.
- Add simple icons or drawings next to key points to support visual memory.
- Write large enough for students sitting in the back to read easily.
- Limit each chart to one topic. Trying to cover too much defeats the purpose.
Types of Anchor Charts You Can Use
Not all anchor charts are the same. Different types serve different purposes in instructional design. Knowing which type to use helps you get the most out of every lesson.
Reference Charts
A reference chart is like a cheat sheet for students. It lists rules, formulas, or key terms that kids need to access regularly. For example, a math chart might show the steps for long division. A reading chart might list figurative language terms like similes, metaphors, and idioms. These charts stay on the wall all year and get used constantly.
You can create a reference chart for similes for education topics, helping students remember that a simile compares two things using “like” or “as.” Similarly, a chart on metaphors for education can show how metaphors make direct comparisons without those words. And a chart on idioms for education can list common expressions and their meanings. These kinds of reference charts build strong language arts skills over time.
Process Charts
A process chart walks students through a sequence of steps. It is perfect for procedures, experiments, or problem-solving strategies. For instance, a science chart might show the steps of the scientific method in order. A writing chart might outline the stages of the writing process from brainstorming to publishing.
Process charts are especially helpful for younger students or those who need extra structure. They turn a complex task into manageable steps that students can follow independently.
Strategy Charts
Strategy charts teach students how to approach a task. They might show reading strategies like predicting, questioning, or visualizing while reading. In math, a strategy chart could present different ways to solve a word problem. These charts empower students with tools they can use in any subject.
Anchor Charts Across Different Subjects
One of the best things about anchor charts is their flexibility. You can use them in virtually every subject area. Here is how they work in some common classrooms.
Math Anchor Charts
In math, charts can display multiplication tables, fraction models, or geometry formulas. A chart showing different problem-solving strategies helps students choose the right approach for each question. Teachers often create a new chart for each unit and keep older ones up for review.
Reading and Language Arts
Reading charts are incredibly popular. They might cover reading comprehension strategies, vocabulary-building tips, or grammar rules. A chart on figurative language can help students understand how writers use creative expressions to convey meaning. When students see examples of similes, metaphors, and idioms right on the wall, they start noticing these devices in their own reading.
You can even tie this into broader language exploration by referencing how similes for falling in love compare emotions using “like” or “as,” or how metaphors for falling in love make direct emotional comparisons. Similarly, idioms for falling in love show how everyday phrases carry figurative meanings. While these are more advanced topics, introducing the concept early through simple charts builds a strong foundation for deeper learning later.
Science and Social Studies
In science, a chart might outline the water cycle or the parts of a plant cell. In social studies, it could map out the branches of government or the steps of how a bill becomes a law. These charts turn abstract ideas into something students can point to and discuss.
Common Mistakes to Avoid with Anchor Charts
Even well-meaning teachers can stumble when using anchor charts. Here are the most common pitfalls and how to avoid them.
Overloading Your Charts
The biggest mistake is cramming too much information onto one chart. A cluttered chart overwhelms students instead of helping them. If a chart has more than five or six main points, consider splitting it into two separate charts. Less is almost always more when it comes to visual aids.
Ignoring Student Input
An anchor chart that the teacher makes alone has less impact. Students should be part of the creation process. When they contribute ideas, words, or drawings, the chart becomes a true learning tool. It also builds classroom community and shows students that their voices matter.
Creating Charts and Never Using Them
A chart that hangs on the wall but never gets referenced is just decoration. Make it a habit to point to the chart during lessons. Ask students to look at it for answers. The more you use it, the more it becomes a natural part of your classroom display and teaching resources.
Tips for Making Anchor Charts Stick
Creating a chart is only half the battle. Making sure students actually use and remember it is the real goal. Here is how to make your charts last.
Updating and Referencing
Keep your charts current. As you move through a unit, add new insights or examples. When a chart is no longer relevant, take it down and replace it with something fresh. Students pay more attention to charts that feel alive and current rather than stale and outdated.
Getting Students Involved
Assign students to be “chart keepers.” Their job is to update the chart with new information or fix anything that looks unclear. This small responsibility builds pride and keeps the chart accurate. It also gives every student a reason to engage with the classroom learning materials around them.
You can also take photos of charts and share them digitally. This way, students who were absent or need a review at home can access the same information. Digital copies also save space and make it easy to build a library of teaching resources over the school year.
Making Charts Interactive
Consider adding flaps, sticky notes, or moveable parts to your charts. An interactive chart invites students to touch, flip, and explore. This kind of hands-on engagement turns a passive display into an active learning tool. Students remember more when they physically interact with the material.
Conclusion
Anchor charts are one of the simplest and most effective tools a teacher can use. They support visual learning, boost student engagement, and give every student a reliable place to turn when they need help. Whether you are teaching math, reading, science, or social studies, a well-crafted chart can transform your classroom.
The beauty of anchor charts is that anyone can make them. You do not need special training, expensive materials, or artistic talent. You just need a clear learning goal and a willingness to involve your students in the process. Start small with one chart this week. See how your students respond. You will likely notice more engagement, better retention, and a stronger connection to the material.
Take the time to experiment with different chart types and subjects. Over time, you will build a collection of reference charts that serve your classroom all year long. Your students will thank you for it, and you will wonder how you ever taught without them.
Frequently Asked Questions
What is the purpose of an anchor chart?
An anchor chart serves as a visual reference that captures key concepts, strategies, or processes from a lesson. It helps students remember and apply what they learned by providing a constant, accessible reminder in the classroom.
Who creates anchor charts?
Teachers and students create them together. The collaborative process is a key part of what makes anchor charts effective. When students contribute, they feel ownership and are more likely to use the chart.
Can anchor charts be used in digital classrooms?
Absolutely. Digital anchor charts can be created using tools like Google Slides, Jamboard, or interactive whiteboards. They work just as well online, giving remote students access to the same visual supports.
How often should I update my anchor charts?
Update them as your lessons progress. Remove outdated charts and replace them with new ones that match current learning objectives. A chart that stays relevant keeps students engaged with it.
Do anchor charts really improve learning?
Yes. Visual learning tools like anchor charts help students retain information better. They support multiple learning styles and give students a concrete resource to return to during independent work or group activities.
What supplies do I need to make an anchor chart?
You only need chart paper, markers, and a clear topic. Some teachers add sticky notes, index cards, or printed images for extra detail. The focus should always be on clarity, not fancy materials.
=== CONCLUSION ===
Anchor charts are a must-have in any classroom that values student engagement and visual learning. They turn abstract ideas into concrete references that students can use every day. From math to language arts, these simple tools make a big impact. Start creating your own anchor charts today and watch your classroom come alive with active, confident learners.