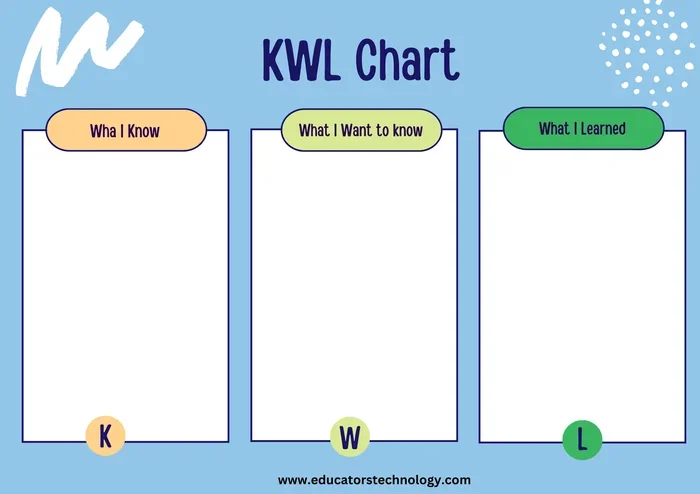
A KWL chart is a simple yet powerful graphic organizer that helps students track what they Know, what they Want to know, and what they Learned. This teaching strategy activates prior knowledge, boosts student engagement, and improves reading comprehension across all subjects. It is one of the most widely used instructional strategies in modern classrooms.
A KWL chart is one of those teaching tools that sounds simple but delivers serious results. If you have ever wondered how to get students more involved in their own learning, this graphic organizer might be the answer. It has been a staple in classrooms for decades, and for good reason. It works.
In this article, we will break down exactly what a KWL chart is, how it works, and why it remains one of the most effective teaching strategies available today. Whether you are a seasoned educator looking for fresh ideas or a new teacher building your lesson planning toolkit, you will find practical tips you can use right away.
Before we dive in, let us set the stage. Think of a KWL chart as a roadmap for learning. It tells students where they are starting, where they want to go, and how far they have come. That is the power of a well-designed educational tool. Now let us explore it in detail.
Key Takeaways
- A KWL chart is a three-column graphic organizer that guides students through the learning process before, during, and after a lesson.
- It activates prior knowledge by asking students to recall what they already know about a topic.
- KWL charts improve reading comprehension and encourage critical thinking in students of all ages.
- The strategy is incredibly versatile and works across subjects, grade levels, and learning environments.
- Creating a KWL chart is simple and requires no special tools or technology.
- Teachers can adapt the KWL format with variations like KWLF (adding “Found”) or KWHL (adding “How”).
- Regular use of KWL charts builds reflective learning habits that benefit students long-term.
📑 Table of Contents
What Is a KWL Chart?
A KWL chart is a three-column graphic organizer used in education to structure and guide the learning process. The name comes from the three columns it contains:
- K stands for “What I Know” — what the student already understands about a topic.
- W stands for “What I Want to Know” — what the student hopes to learn or discover.
- L stands for “What I Learned” — what the student takes away after the lesson or reading.
This instructional strategy was developed by education researcher Donna Ogle in 1986. Her goal was simple: give students a way to take an active role in their learning instead of passively absorbing information. The KWL chart does exactly that. It turns students into self-directed learners who think about their own thinking.
One reason the KWL chart has stood the test of time is its flexibility. You can use it with any age group, any subject, and any type of content. Whether you are teaching reading comprehension in elementary school or exploring complex critical thinking exercises in high school, this tool adapts to your needs.
Teachers often use the KWL chart as a classroom activity at the start of a new unit. It helps students connect new material to what they already understand. This connection is the foundation of knowledge activation, which is a key step in effective learning.
Why Is It Called a KWL Chart?
The name is straightforward. Each letter represents a phase of the learning journey. The K column captures what students bring to the table before the lesson begins. The W column sparks curiosity and sets a purpose for learning. The L column provides a space for reflection and consolidation. Together, these three columns create a complete learning cycle that students can follow with ease.
How Does a KWL Chart Work in Practice?
Using a KWL chart is easier than you might think. The process is intuitive, which is part of why it works so well. Let us walk through each column step by step.
The “K” Column: What I Know
This is where students brainstorm everything they already know about a topic. It could be facts, ideas, experiences, or even misconceptions. The goal is not to be right or wrong. The goal is to surface what is already in their minds. This step is crucial for knowledge activation. When students see what they already know, they build a foundation to attach new information to.
For example, if the topic is the solar system, a student might write “Earth orbits the sun” or “There are eight planets.” These existing ideas become anchors for new learning. Teachers can also use this column to identify gaps or misunderstandings early on.
The “W” Column: What I Want to Know
This column is all about curiosity. Students write down questions they have about the topic. These questions give them a clear purpose for reading or listening. Instead of passively receiving information, students actively search for answers. This shift from passive to active learning is one of the biggest benefits of the KWL chart.
Some questions might be broad, like “How do planets form?” Others might be specific, like “Why is Jupiter so big?” Either way, the W column keeps students engaged and focused throughout the lesson.
The “L” Column: What I Learned
After the lesson, reading, or activity, students fill in the L column. They summarize what they have learned in their own words. This reflection step is essential for reflective learning and long-term retention. It also gives teachers a quick way to assess understanding.
The L column often surprises students. They realize they learned more than they expected or that some of their earlier assumptions were wrong. That moment of realization is where real growth happens.
Why KWL Charts Matter in Education
The KWL chart is not just another worksheet. It is a research-backed teaching strategy that supports multiple aspects of learning. Let us look at why it matters so much.
It Activates Prior Knowledge
Learning does not happen in a vacuum. Students build new understanding on top of what they already know. The K column of a KWL chart makes this process visible. When students see their existing knowledge on paper, they are more prepared to connect it to new ideas. This knowledge activation step is one of the most important parts of any lesson planning process.
It Boosts Reading Comprehension
One of the most common uses for a KWL chart is improving reading comprehension. Before reading a text, students use the K and W columns to set a purpose. As they read, they look for answers to their own questions. After reading, the L column helps them summarize and process what they read. This active approach to reading leads to deeper understanding and better retention.
It Encourages Student Ownership
When students fill in a KWL chart, they take charge of their learning. They decide what they know and what they want to know. This sense of ownership increases motivation and engagement. Instead of waiting for a teacher to deliver information, students become curious explorers.
It Supports Different Learning Styles
Not every student learns the same way. Some are visual learners who benefit from seeing information organized on a page. Others are verbal learners who thrive when they write and discuss ideas. The KWL chart accommodates both styles. It provides a visual structure while also encouraging written and verbal reflection.
How to Create a KWL Chart
Creating a KWL chart is simple. You do not need special software or expensive materials. Here is how to do it.
- Draw a table with three columns. Label them “K,” “W,” and “L.”
- Write the topic at the top of the chart.
- Have students fill in the K column first. Give them a few minutes to brainstorm individually or as a group.
- Move to the W column. Ask students to write down questions or things they are curious about.
- Conduct your lesson or reading activity. Students should keep the chart in mind as they engage with the material.
- Fill in the L column after the lesson. Students write what they learned, either individually or as a class discussion.
You can create a KWL chart on a whiteboard, a piece of poster paper, or even a simple handout. For digital classrooms, tools like Google Docs or interactive whiteboards work great too. The format matters less than the process.
Many teachers also use variations of the basic KWL chart to add more depth. The KWLF chart adds an “F” column for “Found,” where students note where they discovered the answers. The KWHL chart adds an “H” column for “How,” prompting students to think about their learning process. These small tweaks can make the educational tool even more powerful.
Tips for Using KWL Charts Effectively
Using a KWL chart is one thing. Using it well is another. Here are some practical tips to get the most out of this instructional strategy.
Start Small
If your students are new to KWL charts, keep the first one simple. Use a familiar topic so students feel confident. Once they understand the process, you can move to more complex subjects. Starting small builds confidence and reduces resistance.
Encourage Honest Entries
Tell students there are no wrong answers in the K column. Some students may have misconceptions, and that is okay. The whole point is to surface what they think they know so they can correct it later. An honest K column makes the L column more meaningful.
Use It Across Subjects
Do not limit the KWL chart to reading class. Use it in science, social studies, math, and even art. For example, before a science experiment, students can list what they know about the topic and what they want to discover. The KWL chart works anywhere learning happens.
You can also pair the KWL chart with other teaching tools. For instance, you might introduce a topic by discussing common similes for education to spark creative thinking, then move into the KWL chart for structured reflection. Similarly, exploring metaphors for education or idioms for education can be a fun warm-up activity that primes students for deeper learning with the chart.
Make It Collaborative
Have students work in pairs or small groups to fill in the chart. Collaboration brings different perspectives to the table. Students learn from each other’s prior knowledge and questions. This social element adds another layer of student engagement to the activity.
Revisit the Chart
A KWL chart is not a one-and-done activity. Go back to it during review sessions. Ask students to compare their K column with their L column. Did their understanding grow? Were there any surprises? This revisiting strengthens reflective learning and helps students see their own progress.
KWL Charts and Different Subjects
The beauty of the KWL chart is that it fits into virtually any subject area. Here are a few examples to spark your creativity.
| Subject | K Column Example | W Column Example | L Column Example |
|---|---|---|---|
| Science | Plants need sunlight to grow | How do plants make their own food? | Plants use photosynthesis to convert sunlight into energy |
| History | The Civil War happened in the 1800s | What caused the Civil War? | Slavery and states’ rights were major causes |
| Math | Fractions represent parts of a whole | How do you add fractions with different denominators? | You find a common denominator before adding |
| English | A simile uses “like” or “as” | What is the difference between a simile and a metaphor? | A metaphor directly compares two things without using “like” or “as” |
As you can see, the KWL chart works for both factual and conceptual topics. It helps students organize their thoughts and track their growth. The three-column structure gives them a clear framework that reduces overwhelm and increases focus.
Common Mistakes to Avoid
Even with a simple tool like the KWL chart, there are a few pitfalls to watch out for.
- Skipping the K column. Some teachers jump straight to the lesson without activating prior knowledge. This misses the whole point of the chart. Always start with what students already know.
- Making the W column too vague. “I want to know everything” is not a useful question. Encourage specific, focused questions that students can answer through the lesson.
- Rushing the L column. Reflection takes time. Do not squeeze it into the last minute of class. Give students space to think deeply about what they learned.
- Using the chart only once. A single KWL chart is helpful. Revisiting charts over multiple lessons builds stronger reflective learning habits.
- Ignoring student questions. If a student writes a question in the W column that the lesson does not answer, that is a teachable moment. Address it or add it to a “parking lot” for future exploration.
Expert Insights on KWL Charts
Education researchers and experienced teachers agree on the value of the KWL chart. Dr. Donna Ogle, who created the strategy, designed it to help students become more aware of their own learning process. Since then, countless studies have confirmed its effectiveness in improving reading comprehension and student engagement.
Teachers who use KWL charts regularly report that students become more confident and self-aware learners. The chart gives them a visible record of their growth. When students see a nearly empty K column and a full L column, they can clearly see how much they have learned. That sense of accomplishment is powerful.
Experts also emphasize that the KWL chart is not just for struggling students. Advanced learners benefit from it too. It challenges them to articulate their thinking, question their assumptions, and go deeper into a topic. The educational tool scales with the learner, which is part of its enduring appeal.
Key Takeaways
- A KWL chart is a three-column graphic organizer that guides students through the learning process before, during, and after a lesson.
- It activates prior knowledge by asking students to recall what they already know about a topic.
- KWL charts improve reading comprehension and encourage critical thinking in students of all ages.
- The strategy is incredibly versatile and works across subjects, grade levels, and learning environments.
- Creating a KWL chart is simple and requires no special tools or technology.
- Teachers can adapt the KWL format with variations like KWLF (adding “Found”) or KWHL (adding “How”).
- Regular use of KWL charts builds reflective learning habits that benefit students long-term.
Conclusion
The KWL chart is one of the most practical and effective teaching strategies you can use in any classroom. It is simple, flexible, and backed by decades of research. Whether you are teaching reading comprehension, science, history, or any other subject, this graphic organizer helps students take an active role in their learning journey.
By activating prior knowledge, sparking curiosity, and encouraging reflection, the KWL chart does more than organize information. It builds confident, self-aware learners who understand how they learn best. That is a skill that extends far beyond any single lesson or unit.
If you have not tried a KWL chart yet, now is the perfect time to start. Grab a piece of paper, draw three columns, and watch your students engage with their learning in a whole new way. The KWL chart is proof that sometimes the simplest tools make the biggest difference.
Frequently Asked Questions
What does KWL stand for in education?
KWL stands for “Know,” “Want to Know,” and “Learned.” It is a three-column graphic organizer used to guide students through the learning process. Each column represents a different phase: what students already know, what they want to discover, and what they actually learned.
Who invented the KWL chart?
Education researcher Donna Ogle developed the KWL chart in 1986. She created it as a teaching strategy to help students become more active and aware learners. Her goal was to give students a simple tool to track their own learning journey.
Can KWL charts be used for online learning?
Absolutely. KWL charts work just as well in online and hybrid learning environments as they do in traditional classrooms. Teachers can use digital tools like Google Docs, Jamboard, or interactive whiteboards to create collaborative KWL charts that students fill in remotely.
What is the difference between a KWL chart and a KWLF chart?
A KWLF chart adds a fourth column: “F” for “Found.” This extra column asks students to note where they found the answers to their questions. It adds another layer of reflective learning and helps students develop research skills alongside content knowledge.
Are KWL charts suitable for all grade levels?
Yes. The KWL chart is one of the most adaptable educational tools available. Teachers use it with elementary students, middle schoolers, high schoolers, and even adult learners. The only adjustment needed is the complexity of the topics and the level of support provided.
How often should teachers use KWL charts?
There is no set rule, but using a KWL chart at the start of each new unit or major topic is a great habit. Regular use helps students build critical thinking and reflective learning skills naturally. Over time, students may even start the process without being prompted.